After I compile a lot of data, I like to analyze it.
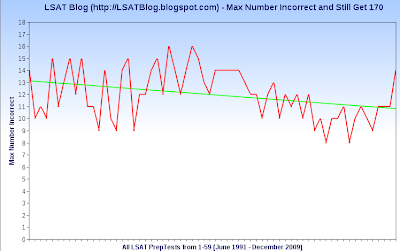
When I wrote the article on Raw Score Conversion Charts for LSAT PrepTests, I decided to create a graph illustrating the maximum number of questions you can miss on every LSAT PrepTest and still get a 170. (I also made one about getting a 160 – scroll to the end for info about that one)
(Click image to enlarge, and see details and analysis below.)
Details
This graph covers released LSAT PrepTests 1 – PrepTest 59. It includes the SuperPrep exams, the Feb 97 LSAT, and the June 07 LSAT (PDF), and it places all exams in chronological order from left-to-right on the x-axis.
(In the data lists below, “SP” stands for SuperPrep, Official (Feb 97) is the Official LSAT PrepTest with Explanations, and Free (June 07) PrepTest on LSAC’s website.)
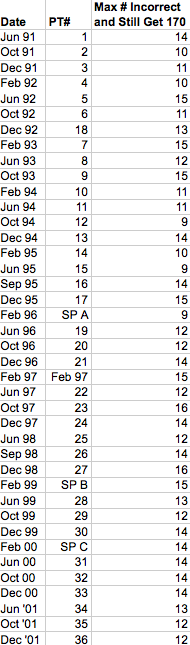
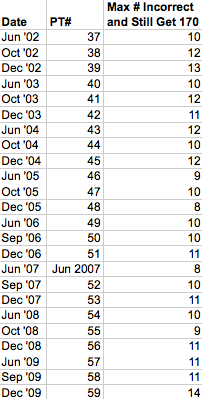
There wasn’t enough space to include the data for the x-axis (the horizontal line) on the graph itself. However, I’ve uploaded the data as 2 separate images below (click images to enlarge) so you can see the # of questions you can miss and still get a 170 for specific PrepTests.
You might wonder why I look at the number of questions you can get wrong and still get a 170. Why don’t I look at the number of questions you need to get right?
Because not all exams have the same number of questions. The # of questions of exams has ranged from 99 to 102. For this reason, it makes sense to look at the difference between the number of questions required for a 170 score and the total number of questions on a given exam.
Data Images
(Click images to enlarge.)
PrepTests 1-36:
Analysis
As you can see, there’s been a significant downward trend in the number of questions you can get wrong and still get 170. That green line on the graph illustrates this decreasing average.
Basically, you can’t miss as many questions today as you used to and still get a 170. The average has moved from -13 (13 incorrect) to -11. A change of 2 raw score points (getting 2 fewer questions wrong) might not seem very significant, but it’s significant when the historical range is only 8-16.
The cushy days of getting 15 or 16 questions incorrect but still walking away with a 170 score are long gone.
What does this all mean for you?
I only posted this graph and data to satisfy your curiosity and give you a sense of the trend.
In short, the raw score conversion charts of older exams don’t adequately represent those of more recent exams. There’s been a shift. You’ll need to get more questions right than you would’ve in the past in order to get a 170.
The bottom line:
Your goal should be the same as its always been – get as many questions correct as possible.
***
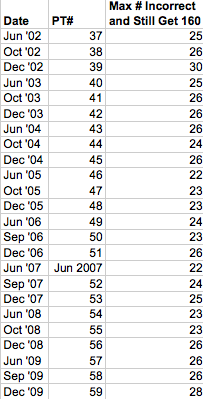
I made a similar graph depicting how many questions you can get wrong and still get a 160. As you might expect, there’s a downward trend for that one also.
(Click image to enlarge.)
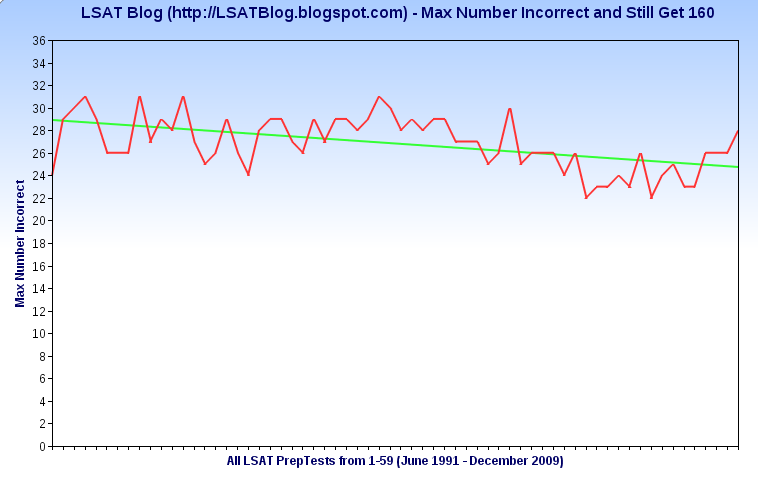
The range for this graph is 22-31 questions incorrect, with the -31 occurring some time ago and the -22 being much more recent. The average # of questions you can get wrong and still get a 160 has dropped from 29 to 25.
My analysis for this is pretty much the same as for the 170 graph.
Data Images
(Click images to enlarge.)
PrepTests 1-36: